Год: 2026 2025 2024 2023 2022 2021 2020 2019 2018 2017 2016 2015 2014 2013 2012 2011 2010 2009 2008 2007
2006 2005 2004 2003 2002 2001 2000 1999 1998 1997 1996 1995 1994 1993 1992 1991 1990 1989 1988 1987
2024
Air Composition over the Russian Arctic: 3—Trace Gases
Atmospheric and Oceanic Optics 2024 №1


O. Yu. Antokhina, P. N. Antokhin, V. G. Arshinova, M. Yu. Arshinov, G. Ancellet, B. D. Belan, S. B. Belan, D. K. Davydov, G. A. Ivlev, A. V. Kozlov, K. Law, P. Nédélec, T. M. Rasskazchikova, J.-D. Paris, D. E. Savkin, D. V. Simonenkov, T. K. Sklyadneva, G. N. Tolmachev, and A. V. Fofonov
        Abstract—Based on the results of a comprehensive experiment conducted in September 2020, the spatial distribution of the following trace gases over the seas of the Russian Arctic are analyzed: carbon monoxide (CO), ozone (O3), nitrogen oxide and dioxide (NO and NO2), and sulfur dioxide (SO2). It is shown that the gas concentrations in the surface air layer over the seas (at an altitude of 200 m) vary in the range 18–36 ppb for O3, 60–130 ppb for CO, 0.005–0.12 ppb for NO, 0.10–1.00 ppb for NO2, and 0.06–0.80 ppb for SO2. The distribution of the gases over the water area is heterogeneous over most seas, which most likely reflects differences in their uptake by the ocean and peculiarities of transport from the continent.
        Arctic, atmosphere, air, vertical distribution, nitrogen dioxide, sulfur dioxide, ozone, nitrogen oxide, carbon monoxide, transport, impurities, composition DOI: 10.1134/S1024856023700057
скачать Открыть (4.8 Mb)
Дата добавления на сайт 2026-01-21 12:34:28
Spatial Distribution of Methane Concentration in Baikal Surface Water in the Spring Period
Atmospheric and Oceanic Optics 2024 №2


D. A. Pestunov, A. M. Shamrin, V. M. Domysheva, M. V. Sakirko, and M. V. Panchenko
        The results of describing the spatial distribution of methane concentration in the surface water of Lake Baikal in the spring are presented. The basis was the measurements of CH4 content which were first carried out in the round-the-clock continuous mode along the entire route of the passage of research vessel in the complex expeditions of Limnological Institute, Siberian Branch, Russian Academy of Sciences, in the spring seasons of 2013, 2016, 2017, 2018, 2021, and 2022. Based on the results of six expeditions, a merged data array was compiled; it included 12100 segments (with a step of 0.005° in latitude and 0.01° in longitude) which covered the total area 4466.7 km2 , or 14% of the surface of Lake Baikal. For a more detailed description of the spatial distribution of methane concentrations in surface water throughout the Baikal water area, the statistical characteristics were calculated in four zones: between 0 and 100 m, 100 and 200 m, 200 and 400 m, and over 400 m isobaths. The comparison of the methane concentrations in the analyzed array with the data of other researchers obtained in different years in nearby regions of the water area made it possible to conclude that the results presented in the work adequately reflect the most stable features of the spatial distribution of methane concentration in surface water of Lake Baikal in spring seasons
        Lake Baikal, greenhouse effect, climate, concentration, methane, surface water, oxygen, biogenic elements, partial pressure, equilibrator, isobaths DOI: 10.1134/S1024856024700374
скачать Открыть (2.6 Mb)
Дата добавления на сайт 2026-01-21 13:35:02
Carbon Dioxide Emissions from Freshwater Systems in Western Siberia
Atmospheric and Oceanic Optics 2024 №2


M. Yu. Arshinov, B. D. Belan, D. K. Davydov, D. V. Simonenkov, and A. V. Fofonov
        One of the possible sources of carbon dioxide emission into the atmosphere can be river ecosystems. The paper presents the results of measuring CO2 fluxes from the surface of several rivers and lakes in Tomsk Region. In the experimental period, average carbon dioxide fluxes were 143.7 ± 21.7 (August 13–14, 2023), 53.3 ± 21.2 (August 19), and 80.4 ± 59.9 mgC m−2 h−1 for the Ob River; 66.1 ± 17.3 mgC m−2 h−1 for the Ket River; 33.3 ± 17.3 mgC m−2 h−1 for the swamp Karasevoye Lake, 50.2 ± 23.0 mgC m−2 h−1 for the Suiga River, and 81.9 ± 11.5 mgC m−2 h−1 for the Iksa River. The flux magnitudes significantly depended not only on the object of the study, but also on hydrometeorological conditions.
        atmosphere, air, flux, river, carbon dioxide, emission DOI: 10.1134/S1024856024700386
скачать Открыть (0.9 Mb)
Дата добавления на сайт 2026-01-22 10:06:00
Air Composition over the Russian Arctic–4: Atmospheric Aerosols
Atmospheric and Oceanic Optics 2024 №3


O. Yu. Antokhina, P. N. Antokhin, V. G. Arshinova, M. Yu. Arshinov, B. D. Belan, S. B. Belan, O. I. Berdashkinova, L. P. Golobokova, D. K. Davydov, G. A. Ivlev, A. V. Kozlov, N. A. Onischuk, T. M. Rasskazchikova, D. E. Savkin, D. V. Simonenkov, T. K. Sklyadneva, G. N. Tolmachev, A. V. Fofonov, and T. V. Khodzher
        This work presents the analysis of the spatial distribution of number concentration, size distribution, and chemical composition of aerosol particles measured for the first time over the seas of the Russian Arctic. Various types of vertical distribution of the number concentration were recorded, characteristic of both coastal marine and continental areas. Most of them turned out to be of the continental type. Attention is also drawn to the almost complete absence of coarse particles above 2–3 km over all seas. The chemical composition of the Arctic aerosol at altitudes of both 200 m and 5000 m contains ions that can be referred to as both marine and continental. The identifiable carbon- and salt-free elemental part of the aerosol over the Arctic is 3–4 times larger than that of ions. Over all seas and at both altitudes, the Arctic aerosols mainly contain elements of terrigenous origin – Al, Cu, Fe, and Si. Over almost all seas, except the Barents Sea, Si is dominant in the elemental composition of the aerosol, its contribution over the Chukchi Sea reaching 85%. The analysis of backward trajectories showed that in all cases considered, whether the aerosol was formed over the continent or sea, air trajectories passed both over sea and over land. In this case, the formed particles could be enriched with additional ions and elements along their pathway. This work completes a cycle of the papers, devoted to studying air composition, which was carried out over the seas of the Russian Arctic in September 2020. Our results can be used to model the atmospheric processes occurring in the Arctic under the conditions of changing climate.
        Arctic, atmosphere, aerosol, air, vertical distribution, transport, impurity, number concentration, chemical composition DOI: 10.1134/S102485602470057X
скачать Открыть (3.3 Mb)
Дата добавления на сайт 2026-01-22 10:10:15
Состав воздуха над Российским сектором Арктики в сентябре 2020 г. 4. Атмосферный аэрозоль
Оптика атмосферы и океана 2024 №3


Антохина О. Ю., Антохин П. Н., Аршинова В. Г., Аршинов М. Ю., Белан Б. Д., Белан С. Б., Бердашкинова О. И., Голобокова Л. П., Давыдов Д. К., Ивлев Г. А., Козлов А. В., Онищук Н. А., Рассказчикова Т. М., Савкин Д. Е., Симоненков Д. В., Скляднева Т. К., Толмачев Г. Н., Фофонов А. В., Ходжер Т. В.
        Впервые анализируется измеренное пространственное распределение счетной концентрации, дисперсного и химического состава аэрозоля над морями Российского сектора Арктики. Были зарегистрированы различные типы вертикального распределения счетной концентрации, характерные как для прибрежных морских, так и континентальных районов. Обнаружено почти полное отсутствие грубодисперсных частиц выше 2–3 км над всеми морями. В химическом составе арктического аэрозоля как на высоте 200 м, так и на уровне 5000 м присутствуют ионы, которые можно отнести и к морским, и к континентальным. Идентифицируемая бессолевая безуглеродная элементная часть аэрозоля над Арктикой в три-четыре раза больше, чем ионная. Над всеми морями и на обеих высотах в состав арктического аэрозоля в основном входят элементы терригенного происхождения Al, Cu, Fe, Si. Почти над всеми морями, кроме Баренцева, в элементном балансе аэрозоля доминирует Si, вклад которого над Чукотским морем достигает 85%. Анализ обратных траекторий показал, что во всех рассмотренных случаях (зарождался ли аэрозоль над континентом или морем) траектории воздушных масс проходили и над морем, и над сушей. В этом случае образовавшиеся частицы могли обогащаться по пути дополнительными ионами и элементами. Данная работа завершает цикл статей, посвященных исследованию состава воздуха, которое было проведено над морями Российского сектора Арктики в сентябре 2020 г. Полученные результаты могут быть использованы при моделировании атмосферных процессов, происходящих в Арктике в условиях изменяющегося климата.
        Арктика, атмосфера, аэрозоль, воздух, вертикальное распределение, перенос, примеси, счетная концентрация, химический состав
скачать Открыть (0.9 Mb)
Дата добавления на сайт 2026-01-23 12:12:02
The Use of the Turbulent Lidar for Aviation Safety
Atmospheric and Oceanic Optics 2024 №4


I. A. Razenkov, B. D. Belan, A. V. Mikhal’chishin, and G. A. Ivlev
        Clear air turbulence (CAT) constitutes the highest danger for aviation in the free atmosphere in the altitude range 6–12 km. Intermittence and random localization of CAT in a quiet surrounding air flow significantly restrict possibilities of its forecasting. Creation of systems for remote detection of turbulent zones becomes especially topical with allowance for climate changes and increase in the probability of CAT appearance. Results of turbulence sounding by the BSE-5 UV lidar from the Optik Tu-134 aircraft laboratory are presented. The in-flight experiment was conducted in September 2022 as part of the Arctic exploration program. The lidar recorded zones of moderate turbulence in the lower troposphere where the probability of turbulence is maximum; isolated cases of CAT were also recorded at an altitude of 9 km. The turbulent lidar can be used in practice for remote detection of turbulent zones at altitudes where most commercial flights are carried out. The prospects of ground-based application of the turbulent lidar for solving aviation safety problems during flights in the lower troposphere are also shown. The results of the BSE-5 lidar sounding in winter, when an increase in the intensity of turbulence in the 0.4–1.6-km layer was recorded during the passage of a cold front, are presented.
        turbulent lidar, backscattering enhancement, Kelvin–Helmholtz instability, clear air turbulence DOI: 10.1134/S1024856024700660
скачать Открыть (1.7 Mb)
Дата добавления на сайт 2026-01-22 10:12:11
Rossby Wave Breaking in the Stratosphere: Part I—Climatology and Long-Term Variability
Atmospheric and Oceanic Optics 2024 №4


O. Yu. Antokhina, A. V. Gochakov, O. S. Zorkaltseva, P. N. Antokhin, and V. N. Krupchatnikov
        The processes of planetary wave breaking (Rossby Wave Breaking – RWB) significantly contribute to variability in stratospheric circulation. Employing a previously developed method for identifying RWB, adapted for stratospheric circulation, this study analyzes the climatology and long-term variability of RWB processes in the middle stratosphere. The method is based on the analysis of potential vorticity (PV) contour geometry at the 850-K level using ERA5 data within the PV range 0–400 PVU (Potential Vorticity Units) determined based on PV field climatology. It was demonstrated that RWB processes exhibit intraseasonal peculiarities. Most frequently, waves break in the northern regions of East Asia and the Pacific Ocean from October to December and in April to March. In January and February, no areas with prevailing RWB processes were identified. We obtained a statistically significant increase in the number of RWB for the first half of winter (October–December) and for the end of the winter period (March and April). For midwinter (January and February), insignificant negative trends were obtained. The results of this work can be used to analyze the long-term variations in stratospheric circulation and, in particular, the occurrence of stratospheric anomalies preceding sudden stratospheric warmings.
        planetary wave breaking, stratosphere, stratospheric polar vortex, sudden stratospheric warming, potential vorticity, contours of potential vorticity DOI: 10.1134/S1024856024700696
скачать Открыть (1.6 Mb)
Дата добавления на сайт 2026-01-22 10:16:28
ОПРЕДЕЛЕНИЕ ОБЩЕГО СОДЕРЖАНИЯ ДИОКСИДА УГЛЕРОДА В АТМОСФЕРЕ ПО ДАННЫМ СПУТНИКОВОГО ФУРЬЕ-СПЕКТРОМЕТРА ИКФС-2: АНАЛИЗ И ОПЫТ ПРИМЕНЕНИЯ
ИССЛЕДОВАНИЕ ЗЕМЛИ ИЗ КОСМОСА 2024 №4


А. Н. Рублев, В. В. Голомолзин, А. Б. Успенский, Ю. В. Киселева, Д. А. Козлов, Б. Д. Белан, М. Ю. Аршинов, Ю. М. Тимофеев, А. В. Панов, А. С. Прокушкин
        На основе ретроспективного сопоставления с данными наземных спектроскопических измерений в Петергофе Санкт-Петербургского государственного университета (СПбГУ) и самолетных измерений в районе Новосибирского водохранилища Института оптики атмосферы им. В.Е. Зуева (ИОА), проведенных в 2019–2022 гг., выполнен анализ результатов применения новой версии регрессионной методики определения общего содержания диоксида углерода XCO2 (мольной доли атмосферного CO2 в сухом воздухе) по измерениям инфракрасного фурье-спектрометра ИКФС-2 российского метеорологического спутника “Метеор-М” №2. Дано описание внесенных изменений в методику с целью повышения точности спутниковых оценок. Так, для компенсации влияния изменения характеристик ИКФС-2 во время длительного полета на оценки XCO2 используется их калибровка по результатам наземных измерений обсерватории NOAA на вулкане Мауна-Лоа (остров Гавайи). После калибровки и фильтрации облачных сцен расхождение спутниковых оценок с данными наземных и самолетных измерений характеризуется средним квадратическим отклонением ~4 млн-1 или 1% от общего содержания XCO2. Чтобы ускорить адаптацию регрессионного алгоритма оценки XCO2 к данным ИКФС-2 на новых спутниках предлагается дополнительно к контактным измерениям концентраций CO2 использовать оценки XCO2 наземной сети TCCON. Также в регрессиях в качестве еще одного предиктора, характеризующего состояние прибора, целесообразно использовать толщину криоосадка на стекле фотоприемника ИКФС-2.
        диоксид углерода, регрессия, оптическая толщина, ИКФС-2, наземные измерения и поперечная горизонтальная циркуляция DOI: 10.31857/S0205961424040051, EDN: EMDUPJ
скачать Открыть (1.3 Mb)
Дата добавления на сайт 2026-01-23 10:42:07
Применение турбулентного лидара для обеспечения авиационной безопасности
Оптика атмосферы и океана 2024 №5


Разенков И. А., Белан Б. Д., Михальчишин А. В., Ивлев Г. А.
        В свободной атмосфере в интервале высот 6–12 км наибольшую опасность для авиации представляет турбулентность ясного неба (ТЯН). Перемежаемость и случайная локализация ТЯН в спокойном окружающем воздушном потоке существенно ограничивают возможности ее прогнозирования. С учетом изменения климата и увеличения вероятности возникновения ТЯН создание систем дистанционного обнаружения турбулентных зон становится особенно актуальным. Приведены результаты зондирования турбулентности ультрафиолетовым лидаром УОР-5 с борта самолета-лаборатории Ту-134 «Оптик». Летный эксперимент проводился в сентябре 2022 г. в рамках программы исследования Арктики. Лидар регистрировал зоны умеренной турбулентности в нижней части тропосферы, где вероятность турбулентности максимальная; также были зафиксированы единичные случаи ТЯН на высоте 9 км. Турбулентный лидар может использоваться на практике для дистанционного обнаружения турбулентных зон на высотах, где осуществляется большинство коммерческих авиарейсов. Также показана перспектива наземного применения турбулентного лидара для решения задач авиационной безопасности при полетах в нижней тропосфере. Представлены результаты зондирования лидаром УОР-5 в зимнее время, когда было зарегистрировано повышение интенсивности турбулентности в слое 0,4–1,6 км при прохождении холодного фронта.
        турбулентный лидар, увеличение обратного рассеяния, неустойчивость Кельвина–Гельмгольца, турбулентность ясного неба DOI: 10.15372/AOO20240506
скачать Открыть (4.2 Mb)
Дата добавления на сайт 2026-01-23 11:49:41
Опрокидывание волн Россби в стратосфере. Часть I. Климатология и долговременная изменчивость
Оптика атмосферы и океана 2024 №5


Антохина О. Ю., Гочаков А. В., Зоркальцева О. С., Антохин П. Н., Крупчатников В. Н.
        Процессы разрушения (опрокидывания) планетарных волн Россби (ОВР) вносят значительную изменчивость в стратосферную циркуляцию. Используя метод идентификации ОВР, адаптированный к условиям циркуляции в стратосфере, анализируются климатология и долговременная изменчивость ОВР в средней стратосфере. В основе метода лежит анализ геометрии контуров потенциальной завихренности (PV – potential vorticity) на уровне 850 К по данным ERA5 для диапазона завихренности 0–400 PVU (единицы PV), выделенного на основании климатологии поля PV. Показано, что ОВР имеет внутрисезонные особенности. Наиболее часто волны разрушаются в северных частях Восточной Азии и Тихого океана с октября по декабрь, а также в апреле и марте; в январе и феврале не выявлено областей с преобладанием процессов ОВР. Мы получили статистически значимое увеличение количества ОВР в начале зимы (октябрь–декабрь) и в конце (март–апрель). Для середины зимы (январь–февраль) были получены незначимые отрицательные тренды. Результаты настоящей работы могут быть использованы при анализе долговременной изменчивости стратосферной циркуляции, в том числе возникновения стратосферных аномалий, предшествующих внезапным стратосферным потеплениям.
        разрушение (опрокидывание) планетарных волн, стратосфера, стратосферный полярный вихрь, внезапные стратосферные потепления, потенциальная завихренность, контуры равной потенциальной завихренности DOI: 10.15372/AOO20240509.
скачать Открыть (5.4 Mb)
Дата добавления на сайт 2026-01-23 11:52:59
Tropospheric Ozone Concentration in Russia in 2023
Atmospheric and Oceanic Optics 2024 №6


V. V. Andreev, M. Yu. Arshinov, B. D. Belan, S. B. Belan, V. A. Gordyushkin, D. K. Davydov, V. I. Demin, N. V. Dudorova, N. F. Elansky, R. V. Ivanov, G. A. Ivlev, A. V. Kozlov, L. V. Konovaltseva, M. Yu. Korenskiy, S. N. Kotel’nikov, I. N. Kuznetsova, V. A. Lapchenko, E. A. Lezina, O. O. Marchenko, V. A. Obolkin, O. V. Postylyakov, V. L. Potemkin, D. E. Savkin, E. G. Semutnikova, I. A. Senik, E. V. Stepanov, G. N. Tolmachev, A. V. Fofonov, T. V. Khodzher, I. V. Chelibanov, V. P. Chelibanov, V. V. Shirotov, Yu. A. Shtabkin, and K. A. Shukurov
        The relevance of studying the dynamics of ozone concentration in the troposphere is due to the fact that in high concentrations it is a strong poison and a powerful oxidant that extremely negatively impacts both biological structures and the environment. Therefore, the dynamics of ozone concentration require urgent study in different areas of the Earth. Based on monitoring data, the paper examines the distribution of tropospheric ozone in Russia in 2023 in the surface air layer, as well as its vertical distribution based on the results of aircraft sensing. It is shown that the maximum permissible daily average concentrations established by the national hygienic standard, including maximal one-time, daily average, and annual average, were exceeded at all measurement sites. The current situation necessitates widespread public awareness of the results of monitoring and the development of environmental protection measures to reduce the concentration of ozone and its precursors in the surface air layer. The results of the work can be useful to specialists in the fields of atmospheric physics, climatology, and environmental protection, as well as to administrative bodies of different responsibility levels.
        atmosphere, air, concentration, ozone, maximum permissible concentration, surface layer, troposphere DOI: 10.1134/S1024856024701112
скачать Открыть (2.6 Mb)
Дата добавления на сайт 2026-01-22 10:25:34
Emission and Sink of Greenhouse Gases in the Grassland Ecosystem of Southern Taiga of Western Siberia: Estimates of the Contribution of Soil Flux Component from Observations of 2023
Atmospheric and Oceanic Optics 2024 №6


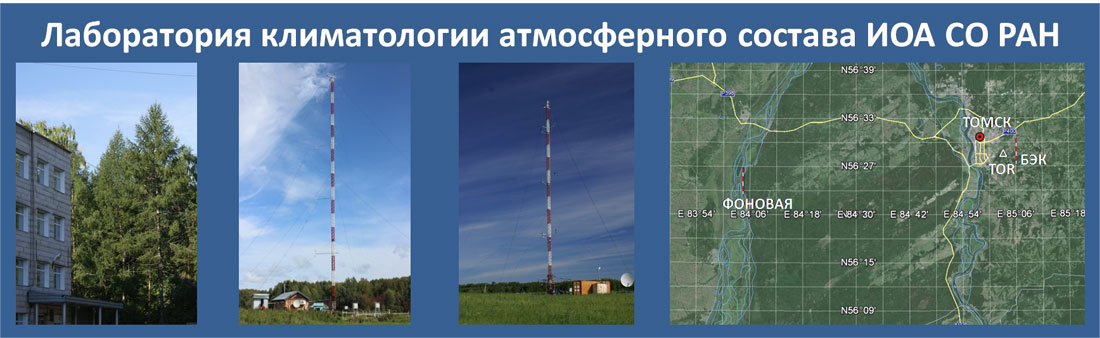
M. Yu. Arshinov, B. D. Belan, D. K. Davydov, A. V. Kozlov, and A. V. Fofonov
        Modern changes in the global climate are accompanied by rising air and soil temperatures. How do they affect soil respiration and should we expect a change in greenhouse gas emissions? These questions cannot be answered without studying the soil–air gas exchange. In this work, we analyze greenhouse gas fluxes at the soil–air interface measured at the Fonovaya Observatory in 2023 with the use of three chambers, transparent and opaque chambers on soil areas with vegetation and a transparent chamber on soil without vegetation. A stable CO2 and CH4 sink throughout the growing season is shown. For carbon dioxide, on the contrary, a weak positive flux was observed. A steady sink of N2O from the atmosphere occurred from May to mid-August; its value attained −600 mg m−2 h−1 in June and July; the methane flux (sink) attained −0.08 mg m−2 h−1. The nitrous oxide flux fluctuated about zero with the daily average within ± 0.02 mg m−2 h−1. For CO2, a nonlinear positive relationship between the increase in vegetation respiration and soil temperature is revealed. Linear temperature dependence is found for methane fluxes in all three chambers, that is, an increase in soil temperature enhances CH4 absorption. N2O fluxes show very weak positive dependence on the soil temperature in both transparent chambers (with and without vegetation). The estimates of the contribution of CO2 fluxes from the soil show that microbial respiration can contribute from 46.7 to 77.9% to the total grassland ecosystem respiration during nighttime. The daily average share of methane absorption by soil due to diffusion and oxidation by methanotrophs not associated with plants varies from 5.3 to 48.3%; it becomes smaller during the daytime and increases at night. The contribution of soil without vegetation to the total N2O flux can attain 92.3%. The results expand knowledge about the soil–air gas exchange under changing climate conditions
        atmosphere, air, methane, nitrous oxide, flux, carbon dioxide, emission DOI: 10.1134/S1024856024701124
скачать Открыть (3.1 Mb)
Дата добавления на сайт 2026-01-22 10:28:19
Airborne Lidar BSE-6 for Remote Detection of Clear-Air Turbulence
Atmospheric and Oceanic Optics 2024 №6


B. D. Belan, I. A. Razenkov, and K. A. Rynkov
        The development of instruments for remote detection of clear-air turbulence (CAT) for early warning of aircraft crew about the danger is an urgent problem today. In this work, we describe the design and technical features of BSE-6 turbulent lidar mounted onboard an aircraft for experimental testing of CAT remote sensing technique. The quality of assembly and adjustment was verified in comparison between theoretical calculations and real echo signals. The system was tested for thermomechanical stability. The improvement of the turbulent lidar is to ensure early detection of CAT from an aircraft and remote control of the turbulence intensity in the atmospheric boundary layer from the ground, for example, along glide paths at airports.
        turbulent lidar, backscatter enhancement effect, clear-air turbulence, aviation safety DOI: 10.1134/S1024856024701173
скачать Открыть (1.9 Mb)
Дата добавления на сайт 2026-01-22 10:30:38
Концентрация тропосферного озона на территории России в 2023 г.
Оптика атмосферы и океана 2024 №8


Андреев В. В., Аршинов М. Ю., Белан Б. Д., Белан С. Б., Гордюшкин В. А., Давыдов Д. К., Демин В. И., Дудорова Н. В., Еланский Н. Ф., Иванов Р. В., Ивлев Г. А., Козлов А. В., Коновальцева Л. В., Коренский М. Ю., Котельников С. Н., Кузнецова И. Н., Лапченко В. А., Лезина Е. А., Марченко О. О., Оболкин В. А., Постыляков О. В., Потемкин В. Л., Савкин Д. Е., Семутникова Е. Г., Сеник И. А., Степанов Е. В., Толмачев Г. Н., Фофонов А. В., Ходжер Т. В., Челибанов И. В., Челибанов В. П., Широтов В. В., Штабкин Ю. А., Шукуров К. А.
        Озон в тропосфере в высоких концентрациях является сильнодействующим ядом и мощным окислителем, крайне негативно воздействующим на биологические объекты и объекты окружающей среды. Поэтому весьма актуально исследование динамики его концентрации во всех регионах планеты. По данным мониторинга рассматривается распределение тропосферного озона на территории России в 2023 г. в приземном слое воздуха, а также его вертикальное распределение по результатам самолетного зондирования. Показано, что во всех пунктах измерений превышались предельно допустимые среднесуточные концентрации, установленные отечественным гигиеническим нормативом: максимальные разовые, среднесуточные и среднегодовые. В связи со сложившейся ситуацией необходимы широкое информирование населения о результатах мониторинга и разработка природоохранных мероприятий по снижению уровня концентрации озона и его прекурсоров в приземном слое воздуха. Результаты работы могут быть полезны специалистам в области физики атмосферы, климатологии, охраны окружающей среды, а также административным органам разных уровней.
        атмосфера, воздух, концентрация, озон, предельно допустимая концентрация, приземный слой, тропосфера DOI: 10.15372/AOO20240809
скачать Открыть (3.4 Mb)
Дата добавления на сайт 2026-01-23 12:14:53
Алгоритм усвоения данных на основе оператора чувствительности для трехмерной модели переноса и трансформации примесей в атмосфере.
Оптика атмосферы и океана 2024 №9


Пененко А. В., Гочаков А. В., Антохин П. Н.
        Трехмерные модели переноса и трансформации примеси позволяют учитывать вертикальную неоднородность атмосферных процессов. Однако их использование требует задания большого количества параметров и существенных вычислительных ресурсов для проведения расчетов, особенно при решении обратных задач и задач усвоения данных. Представлен новый алгоритм усвоения данных для трехмерной модели переноса и трансформации примесей с неизвестными источниками, в котором используется подход на основе операторов чувствительности и ансамблей решений сопряженных уравнений, реализованный в системе обратного моделирования IMDAF для вычислительных комплексов с распределенной памятью. При тестировании на реалистичном сценарии для Байкальского региона алгоритм позволил по данным интегральных измерений по вертикали, моделирующим результаты дистанционного зондирования, уменьшить ошибку расчета поля концентрации примесей на 15%. При дополнительном указании уровня расположения источника по вертикали ошибка расчета поля концентраций сократилась на 93%, ошибка задания функции источника – на 85%.
        усвоение данных, идентификация источников, адвекция–диффузия–реакция, оператор чувствительности, сопряженные уравнения DOI: 10.15372/AOO20240901
скачать Открыть (7.6 Mb)
Дата добавления на сайт 2026-01-23 12:17:23
Эмиссия и поглощение парниковых газов луговой экосистемой южной тайги Западной Сибири: оценка вклада почвенной составляющей по данным наблюдений 2023 г.
Оптика атмосферы и океана 2024 №9


Аршинов М. Ю., Белан Б. Д., Давыдов Д. К., Козлов А. В., Фофонов А. В.
        Современные изменения глобального климата сопровождаются ростом температуры воздуха и почвы. Как они отражаются на почвенном дыхании и следует ли ожидать изменение эмиссии парниковых газов? На эти вопросы невозможно ответить без исследования газообмена почвы и атмосферы. В настоящей работе приводятся результаты анализа удельных потоков парниковых газов на границе раздела «почва – атмосфера», измеренных в обсерватории «Фоновая» в 2023 г. Для измерения потоков были использованы три статические камеры: прозрачная и непрозрачная – на участках почвы с растительностью, и еще одна прозрачная – на участке почвы без растительности. Для СО2 и СН4 был зафиксирован устойчивый сток в течение всего вегетационного сезона, для N2O, наоборот, – слабая положительная эмиссия. Устойчивый сток углекислого газа из атмосферы наблюдался в период с мая до середины августа, его величина достигала -600 мг × м-2 × ч-1 в июне и июле, а величина стока метана составляла -0,08 мг × м-2 × ч-1. Поток закиси азота колебался вблизи нуля, а его среднесуточные вариации почти укладывались в коридор ± 0,02 мг × м-2 × ч-1. Установлена нелинейная положительная зависимость увеличения интенсивности дыхания экосистемы, т.е. эмиссии СО2, от температуры почвы. Для метана получены линейные отрицательные зависимости во всех трех камерах – рост температуры почвы усиливает его поглощение. У N2O очень слабые положительные зависимости в обеих прозрачных камерах (с растительностью и без нее). Оценки вклада эмиссии CO2 из почвы показали, что в ночное время микробное дыхание может вносить вклад в общее дыхание экосистемы от 46,7 до 77,9%. В среднем за сутки доля поглощения метана почвой, обусловленного диффузией и свободной метанотрофией, изменяется от 5,3 до 48,3%. Меньше она становится в дневное время и увеличивается в ночное. Вклад почвы без растительности в общую эмиссию N2O может составлять до 92,3%. Полученные результаты должны расширить сведения о газообмене «почва – атмосфера» в условиях меняющегося климата.
        атмосфера, воздух, закись азота, метан, поток, углекислый газ, эмиссия DOI: 10.15372/AOO20240906
скачать Открыть (4.1 Mb)
Дата добавления на сайт 2026-01-23 12:19:46
Комплексная оценка состава воздуха над Российским сектором Арктики в сентябре 2020 г.
Оптика атмосферы и океана 2024 №10


Антохин П. Н., Аршинова В. Г., Аршинов М. Ю., Белан Б. Д., Белан С. Б., Давыдов Д. К., Ивлев Г. А., Козлов А. В., Рассказчикова Т. М., Савкин Д. Е., Симоненков Д. В., Скляднева Т. К., Толмачев Г. Н., Фофонов А. В.
        В Арктике потепление климата происходит в несколько раз быстрее, чем в других районах земного шара. Это может быть результатом усиления обратных связей между климатом и составом атмосферы. Однако данных об изменениях концентрации климатически активных веществ в этом регионе крайне мало. Поэтому для восполнения пробела в данных о вертикальном распределении газового и аэрозольного составов воздуха над Российским сектором Арктики в сентябре 2020 г. на самолете-лаборатории Ту-134 «Оптик» был проведен эксперимент по зондированию атмосферы и водной поверхности над акваториями всех российских морей Северного Ледовитого океана. В настоящей работе приводится анализ пространственного распределения газового и аэрозольного составов арктической тропосферы. Показано, что в период эксперимента концентрация СО2 в направлении с запада на восток росла в приводном и пограничном слоях и, наоборот, убывала в тропосфере. Содержание же метана в приводном слое в том же направлении уменьшалось. Концентрации СО, NOX и SO2 в Российском секторе Арктики были очень низкими, что характерно для удаленных фоновых районов. Все фракции аэрозоля также демонстрируют убывание содержания с запада на восток. Полученные результаты могут быть использованы при моделировании атмосферных процессов, происходящих в Арктике в условиях изменяющегося климата.
        Арктика, атмосфера, аэрозоль, вертикальное распределение, диоксид серы, метан, озон, оксиды азота, оксиды углерода, перенос, состав DOI: 10.15372/AOO20241002
скачать Открыть (2.2 Mb)
Дата добавления на сайт 2026-01-23 12:22:08
Derivation of the Carbon Dioxide Total Column in the Atmosphere from Satellite-Based Infrared Fourier-Transform Spectrometer IKFS–2 Measurements: Analysis and Application Experience
Atmospheric and Oceanic Physics 2024 №12


A. N. Rubleva, V. V. Golomolzin, A. B. Uspenskii, Yu. V. Kiseleva, D. A. Kozlov, B. D. Belan, M. Yu. Arshinov, Yu. M. Timofeev, A. V. Panov, and A. S. Prokushkin
        Based on retrospective comparison with the data of ground-based spectroscopic measurements carried out in Peterhof by St. Petersburg State University (SPbSU) and aircraft measurements carried out in the area of the Novosibirsk Reservoir by the Zuev Institute of Atmospheric Optics in 2019–2022, results of application of a new version of the regression technique for determining the total carbon dioxide XCO2 content (the mole fraction of atmospheric CO2 in dry air) by measurements of the IKFS-2 infrared Fourier spectrometer of the Meteor-M No. 2 Russian meteorological satellite are analyzed. A description of changes made in the technique to improve the accuracy of satellite estimates is given. For example, to compensate for the influence of changes in IKFS-2 characteristics during a long flight on the XCO2 estimates, they are calibrated based on the results of ground measurements from the NOAA observatory at Mauna Loa volcano (the island of Hawai’i). After calibration and filtering of cloud scenes, the divergence of satellite estimates from ground and aircraft measurements is characterized by a mean square deviation of ~4 ppm or 1% of the total XCO2 content. To speed up the adaptation of the regression algorithm for XCO2 estimation to the IKFS-2 data, it is proposed to use on the new satellites XCO2 estimates from the TCCON ground-based network in addition to the contact measurements of CO2 concentrations. Also, it is reasonable to use in the regressions the thickness of the cryodeposit on the IKFS-2 photodetector glass as another predictor characterizing the state of the instrument.
        carbon dioxide, regression, optical thickness, IKFS-2, ground-based measurements and transverse horizontal circulation DOI: 10.1134/S000143382570029X
скачать Открыть (1.6 Mb)
Дата добавления на сайт 2026-01-22 11:53:01
Сравнение потоков парниковых газов, измеренных с помощью комплексов научного оборудования самолета-лаборатории Як-40 и обсерватории «ZOTTO».
Оптика атмосферы и океана 2024 №12


Антохин П. Н., Аршинова В. Г., Аршинов М. Ю., Арясов В. Е., Белан Б. Д., Белан С. Б., Давыдов Д. К., Ивлев Г. А., Козлов А. В., Панов А. В., Прокушкин А. С., Путилин И. Р., Рассказчикова Т. М., Савкин Д. Е., Симоненков Д. В., Толмачев Г. Н., Фофонов А. В.
        Продолжающееся глобальное потепление климата приводит к необходимости проведения непрерывного мониторинга концентрации парниковых газов и величины их потоков. Газообмен между наземными экосистемами и атмосферой измеряется в основном с помощью метода вихревой ковариации, градиентным и камерным методами. Приводится описание приборных комплексов самолета-лаборатории Як-40 и обсерватории «ZOTTO». Измеренные двумя разными методами потоки СО2 и СН4 на одинаковых высотных уровнях совпадают по знаку, близки по величине для углекислого газа и различаются до двух раз у метана. Полученные результаты представляют интерес для специалистов в области измерения потоков парниковых газов методом вихревой ковариации.
        атмосфера, вертикальное распределение, вихревая ковариация, диоксид углерода, метан, потоки DOI: 10.15372/AOO20241206
скачать Открыть (2.2 Mb)
Дата добавления на сайт 2026-01-23 12:24:50
Динамика фракционного распределения аэрозолей в приземном воздухе бореальной зоны Западной Сибири (по наблюдениям в обсерватории «Фоновая»). Часть 1. Сравнение периодов летней вегетации и зимнего покоя древесных растений.
Оптика атмосферы и океана 2024 №12


Тентюков М. П., Тимушев Д. А., Симоненков Д. В., Белан Б. Д., Шукуров К. А., Козлов А. В.
        Представлены результаты сравнительной характеристики фракционного состава приземного аэрозоля в период летней вегетации и зимнего покоя древесных растений бореальной зоны Западной Сибири. Приведена статистика распределения аэрозольных частиц по размерам во время летней вегетации и зимнего покоя древесных растений на обсерватории «Фоновая» СО РАН (Томская область) в период с 01.07.2022 г. по 30.06.2023 г. Анализ соотношений аэрозольных фракций выявил парадоксальную ситуацию: счетная концентрация аэрозольных частиц диаметром 0,3–2,0 мкм оказалась существенно выше зимой, чем летом. Предложена феноменологическая модель, описывающая данный эффект как проявление сил радиометрической природы.
        atmospheric aerosol, boreal forest, aerosol lifetime, coniferous, radiometric photophoresis, deciduous, forest canopy, aerosol stability DOI: 10.15372/AOO20241211
скачать Открыть (7 Mb)
Дата добавления на сайт 2026-01-23 12:33:13
Culturable Microorganisms of Aerosols Sampled during Aircraft Sounding of the Atmosphere over the Russian Arctic Seas
Atmosphere 2024 №15


Irina S. Andreeva, Aleksandr S. Safatov, Larisa I. Puchkova, Nadezhda A. Solovyanova, Olesya V. Okhlopkova, Maksim E. Rebus, Galina A. Buryak, Boris D. Belan and Denis V. Simonenkov
        Atmospheric sounding using the Tu-134 Optik aircraft-laboratory was conducted in September 2020 over the seas of the Russian sector of the Arctic Ocean, namely the Barents, Kara, Laptev, East Siberian, Chukchi and Bering seas. Unique samples of atmospheric aerosols at altitudes from 200 and up to 10,000 m were taken, including samples for the identification of cultivated microorganisms and their genetic analysis. Data on the concentration and diversity of bacteria and fungi isolated from 24 samples of atmospheric aerosols are presented; the main phenotypic and genomic characteristics were obtained for 152 bacterial cultures; and taxonomic belonging was determined. The concentration of cultured microorganisms detected in aerosols of different locations was similar, averaging 5.5 × 10³ CFU/m3. No dependence of the number of isolated microorganisms on the height and location of aerosol sampling was observed. The presence of pathogenic and condto shitionally pathogenic bacteria, including those referred to in the genera Staphylococcus, Kocuria, Rothia, Comamonas, Brevundimonas, Acinetobacter, and others, as well as fungi represented by the widely spread genera Aureobasidium, Aspergillus, Alternaria, Penicillium, capable of causing infectious and allergic diseases were present in most analyzed samples. Obtained data reveal the necessity of systematic studies of atmospheric microbiota composition to combat emerging population diseases.
        seas of the Russian sector of the Arctic; atmospheric aerosols; aircraft sounding; culturable microorganisms; analysis of genome; biochemical characteristics; biotechnological properties
скачать Открыть (1.5 Mb)
Дата добавления на сайт 2026-01-22 11:42:47
Heatwave reveals potential for enhanced aerosol formation in Siberian boreal forest
Environmental Research Letters 2024 №19


Olga Garmash, Ekaterina Ezhova, Mikhail Arshinov, Boris Belan, Anastasiia Lampilahti, Denis Davydov, Meri Räty, Diego Aliaga, Rima Baalbaki, Tommy Chan, Federico Bianchi, Veli-Matti Kerminen, Tuukka Petäjä and Markku Kulmala
        Siberia is covered by 6 million km2 of forest, which moderates climate as a carbon sink and a source of aerosol particles causing negative radiative effect. Aerosol particles in boreal forests frequently form via gas-to-particle conversion, known as new particle formation (NPF). Compared to boreal sites at similar latitudes, NPF was reported to occur less often in the Siberian forest. However, factors controlling NPF in Siberia remain unknown. Our results suggest that the combination of biogenic and anthropogenic contributions caused unexpectedly high monthly NPF frequency (50%) at the observatory Fonovaya in the West Siberian taiga during the Siberian 2020 heatwave. High frequency was due to early spring photosynthetic recovery, which boosted biogenic emissions into polluted air masses carrying SO2. After mid-April, high temperatures and cleaner air masses led to less frequent (15%) and less intense NPF despite the increased emissions of natural organic vapors and ammonia. Furthermore, the contrast between the two spring periods was seen in cluster composition, particle-forming vapors (two times difference in sulfuric acid concentration), particle formation (J3, 2.2 and 0.4 cm−3 s−1) and growth rates (GR2−3, 1.7 and 0.6 nm h−1). Given the strong warming trend, our results suggest that within 25‒30 years, the monthly NPF frequency during early spring in the West Siberian taiga can reach 40%–60%, as in the European boreal sites.
        secondary aerosol, boreal forest, atmospheric chemistry, pollution, BVOC DOI 10.1088/1748-9326/ad10d5
скачать Открыть (1.8 Mb)
Дата добавления на сайт 2026-01-22 11:49:42
Statistical Characteristics of Mesoscale Fluctuations of Wind Velocity, Temperature, and Gas Concentrations Obtained from Aircraft Measurements in the Troposphere of the Arctic Region
Journal of the Atmospheric Sciences 2024 №81


I. CHUNCHUZOV, O. CHKHETIANI, S. KULICHKOV, O. POPOV, B. BELAN, A. FOFONOV
        The results of airborne measurements and statistical characteristics of mesoscale fluctuations of wind velocity, temperature, and concentrations of gas constituents at different heights of a stably stratified troposphere are presented. The measurements were carried out in September 2022 in the Arctic region of Russia with the aircraft laboratory Tu-134 “Optik.” The obtained spectra and structure functions of the fluctuations are interpreted with the theoretical model of formation of the spectrum of mesoscale wind velocity and temperature fluctuations described in the paper. The presence at high wavenumbers of a steep section in the obtained horizontal wavenumber spectra of the fluctuations of wind velocity and greenhouse gas concentration with a slope close to 23 is discussed. The fluctuation spectra along different slanted tracks of the aircraft crossing the tropospheric layer between altitudes of 1 and 9 km are also obtained and analyzed with the theoretical model.
        Advection; Internal waves; Turbulence; Troposphere; Atmospheric waves https://doi.org/10.1175/JAS-D-23-0021.1
скачать Открыть (14.8 Mb)
Дата добавления на сайт 2026-01-22 12:02:03